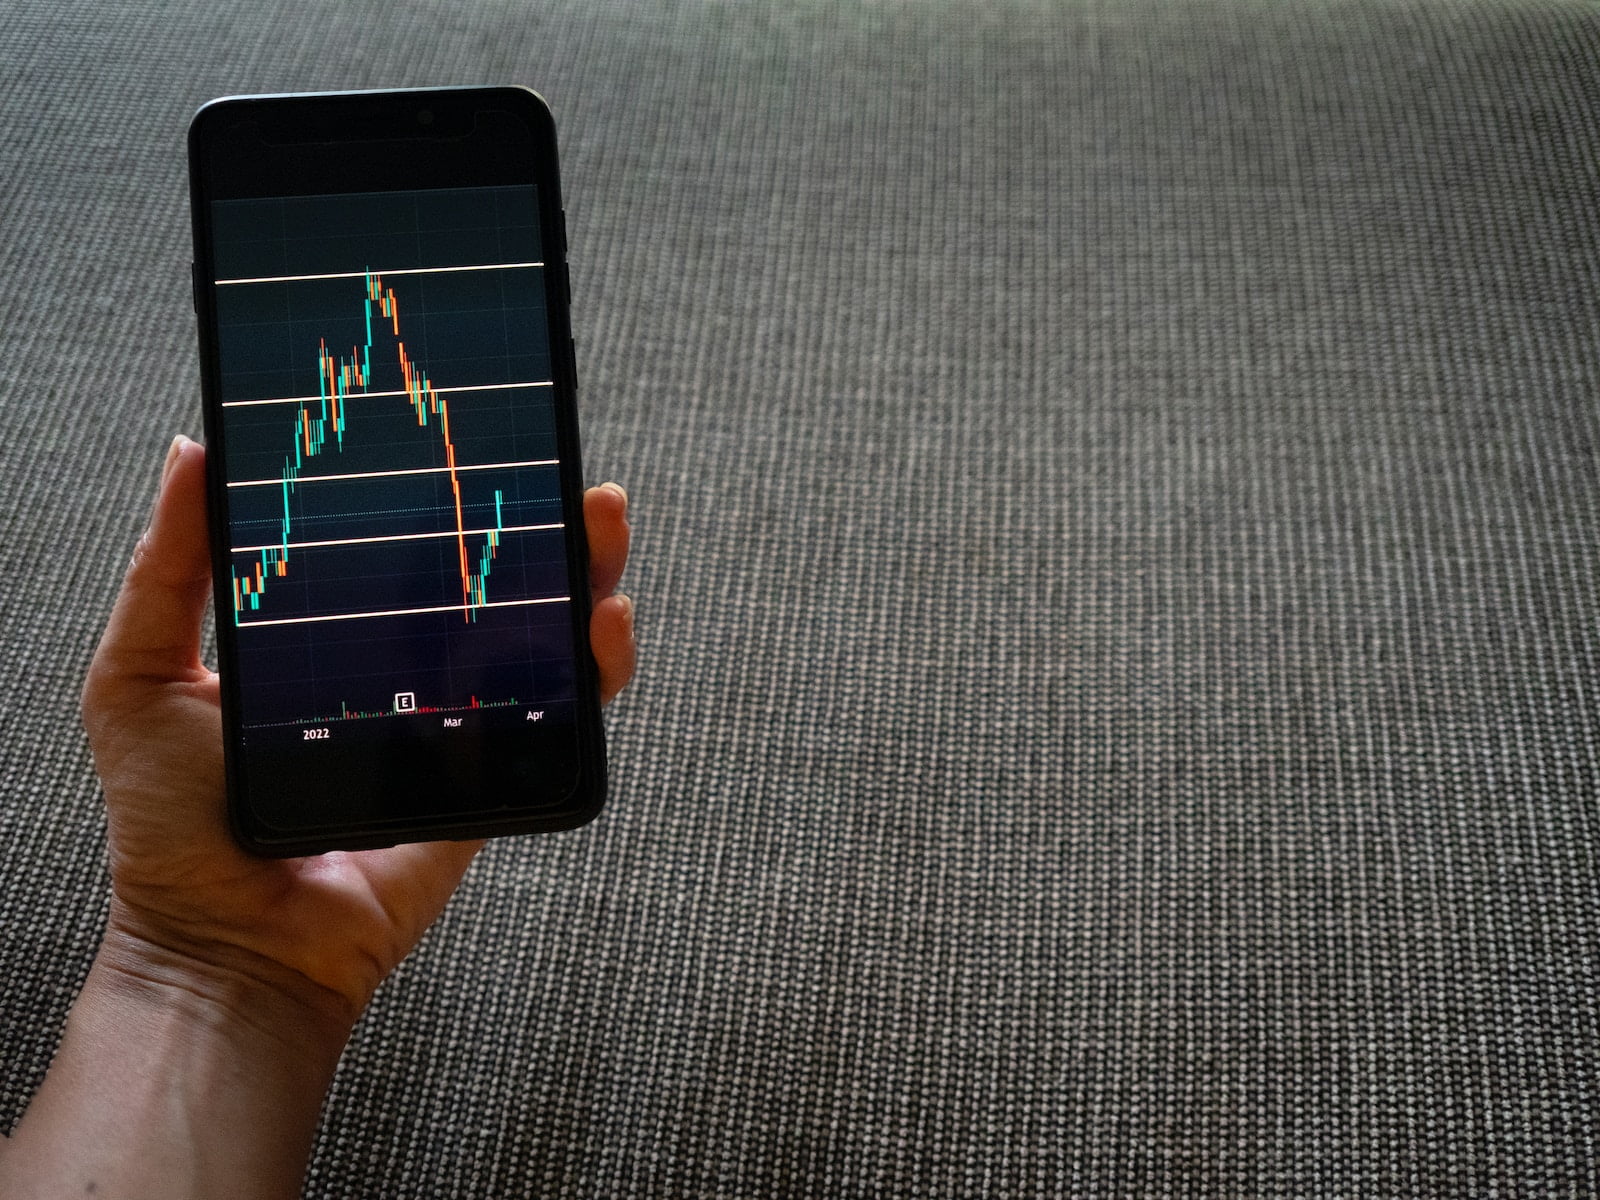
Custom indicators are a vital component of technical analysis in the world of trading. These unique and personalized tools allow traders to gain deeper insights into price movements, identify trends, and make informed trading decisions. In this article, we will explore the significance of custom indicators, their role in technical analysis, and how traders can harness their power to enhance their trading strategies.
Understanding Custom Indicators
In the realm of trading, indicators are mathematical calculations based on price, volume, or open interest that help traders assess market conditions and forecast future price movements. Custom indicators, as the name suggests, are indicators that traders create or customize to suit their specific trading strategies and preferences.
Custom indicators can be built using various programming languages, with MetaQuotes Language (MQL) being one of the most popular for indicators on platforms like MetaTrader 4 (MT4) and MetaTrader 5 (MT5). These indicators can be tailored to analyze specific market data, patterns, or conditions that are not covered by standard indicators.
The Significance of Custom Indicators
Custom indicators offer several key advantages to traders:
Tailored Analysis: Traders can design custom indicators to focus on the specific aspects of the market they are interested in, such as price patterns, volatility, or trend strength.
Unique Strategies: Custom indicators enable traders to implement unique trading strategies that are not achievable with standard indicators, giving them a competitive edge.
Enhanced Accuracy: By customizing indicators, traders can fine-tune their analysis to improve accuracy and reduce false signals.
Personalization: Traders can align their indicators with their trading style, risk tolerance, and market preferences, creating a more personalized trading experience.
Role in Technical Analysis
Custom indicators play a crucial role in technical analysis, which involves the evaluation of historical price and volume data to predict future price movements. Here’s how they contribute to this process:
Identification of Trends: Custom indicators can help traders identify trends in the market, whether they are upward (bullish) or downward (bearish). This information is vital for trend-following strategies.
Confirmation of Patterns: Custom indicators can be used to confirm chart patterns, such as head and shoulders, flags, or triangles, providing traders with additional confidence in their analysis.
Volatility Assessment: Some custom indicators are designed to measure market volatility, helping traders gauge the level of risk and adjust their positions accordingly.
Overbought and Oversold Conditions: Custom indicators can identify overbought and oversold conditions in the market, which can be useful for identifying potential reversal points.
Divergence Detection: Traders often use custom indicators to detect divergences between the indicator and price, which can signal potential trend reversals.
Examples of Custom Indicators
There is a wide range of custom indicators that traders can create or find in the trading community. Some popular examples include:
Moving Average Crossovers: Custom indicators can be designed to signal when short-term moving averages cross above or below longer-term moving averages, indicating potential trend changes.
Relative Strength Index (RSI) Variations: Traders can customize the RSI to suit their trading strategies, altering the overbought and oversold thresholds or changing the smoothing period.
Ichimoku Cloud Variations: The Ichimoku Cloud indicator can be customized to include additional lines or to adjust the calculation method for different market conditions.
Bollinger Bands Modifications: Traders can create custom Bollinger Bands with unique settings to capture price volatility and identify potential reversal points.
Creating and Using Custom Indicators
To create custom indicators, traders typically need programming skills or access to a skilled programmer. Here are the general steps to create and use custom indicators:
Define the Indicator Logic: Clearly outline the logic and criteria for your custom indicator. Decide what market data it will analyze and how it will generate signals.
Write the Code: Use a programming language like MQL for MetaTrader platforms or Python for other trading platforms to write the code for your custom indicator.
Test and Optimize: Backtest your custom indicator on historical data to ensure it performs as expected. Make any necessary adjustments to optimize its accuracy.
Implement in Trading Platform: Once the custom indicator is ready, import it into your trading platform, making it available for use in your charts.
Interpret Signals: Understand how your custom indicator generates signals and incorporate them into your trading strategy.
Custom indicators are a powerful tool in the trader’s toolbox, allowing for personalized and fine-tuned technical analysis. They offer traders the ability to tailor their strategies, identify unique trading opportunities, and improve the accuracy of their decisions. While creating custom
Top of Form

+ There are no comments
Add yours